THERMODYNAMIC ANALYSIS
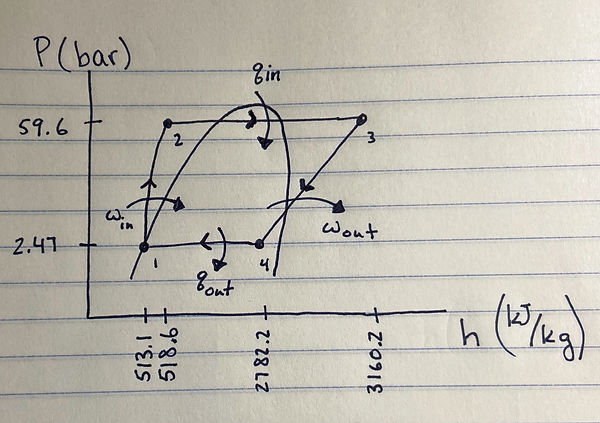
Shown above is our P-h diagram of the second Rankine cycle which utilizes coal boilers at the Abbot Power Plant.
Operating Parameters

The table above shows the various operating parameters of each component in Abbott Power Plant. These were taken directly from data sheets for each components. All pressures show are gauge pressures.
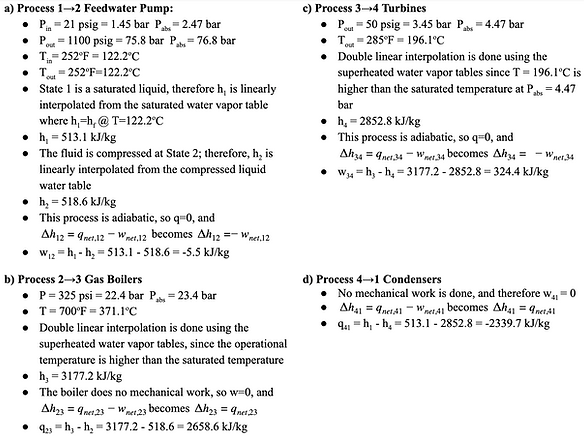
FIRST RANKINE CYCLE
Using gas boilers

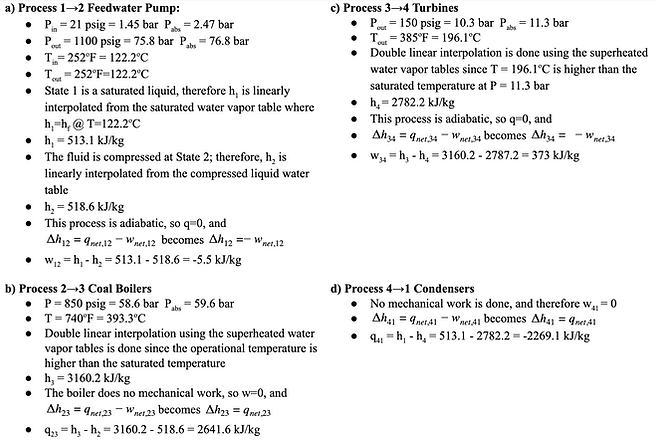
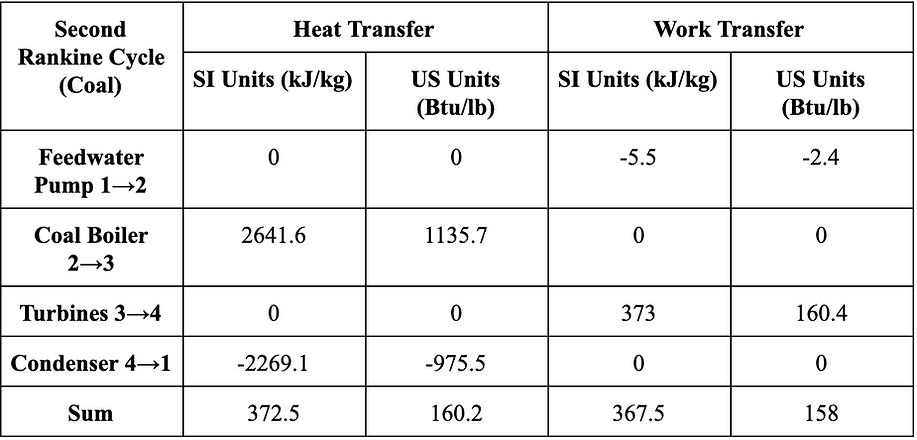
SECOND RANKINE CYCLE
Using coal boilers

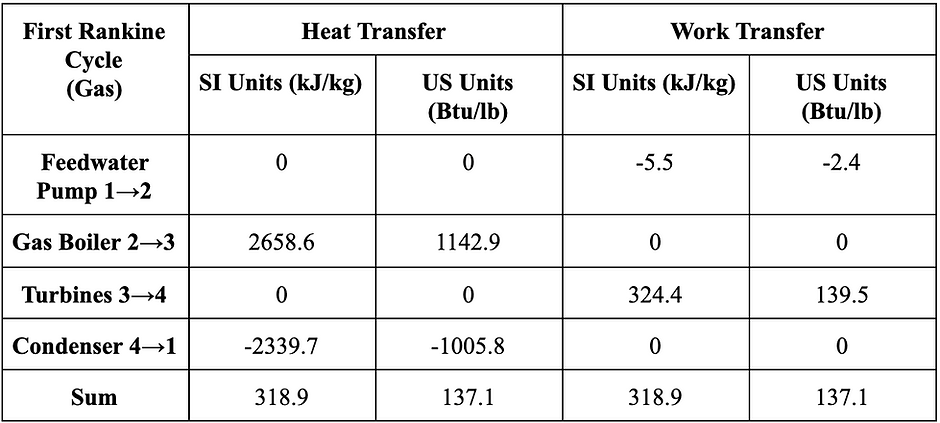
The calculations can be summed up in the tables below, where you will also see the work and heat transfer for each process
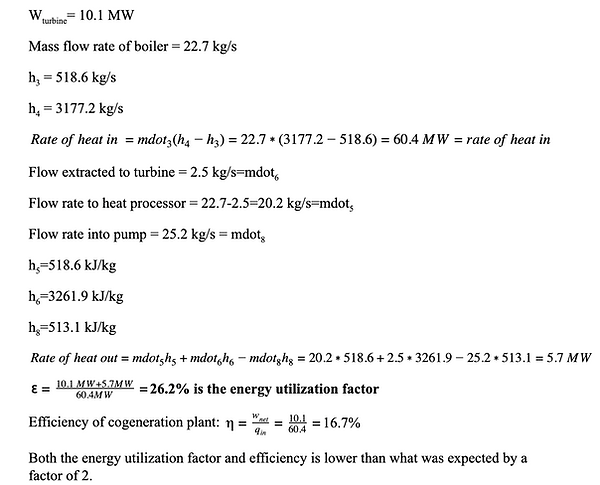
Electricity+Heat Generation (Cogeneration)

FINDINGS
Each process in the Rankine cycle has its own work or heat exchange--however, because this is a power cycle, we can say that the first law of thermodynamics requires that the net change in work in our system must equal the net change in energy via heat transfer of our system. Our cycle takes place in a closed system that exchanges energy but not matter with the surroundings, though each individual process is an open system. For the first rankine cycle analysis, our heat transfer is 318.9 kJ/kg, and our net work done by the system is 318.9 kJ/kg. For the second rankine cycle analysis, the net heat transfer is 372.5 kJ/kg, and our net work done by the system is 367.5 kJ/kg. We expected the net heat transfer to equal the net work done for the second rankine cycle. We are attributing the difference between the net work done and the net heat transfer to rounding numbers.
Additionally, we can say that because the entropy of our system must always increase (according to the second law of thermodynamics), our thermal efficiency shouldn’t be at 100%. Indeed, they are at 12.0% and 13.9% for the gas and coal boilers, respectively. Some of the best vapor power plants of our time have thermal efficiencies up to 47%. However, these are ‘supercritical’ power plants that operate on steam at pressures near 300 bar, nearly 6 times the operating pressure of Abbott Power plant. This would explain why the efficiency of this plant must be much lower than 47%.
If we look at the data sheets for the turbines at Abbott Power plant (specifically page 8 of turbine data sheets 1), we find that each of the generators produces anywhere from 3650 to 3750 kW when fed steam at a rate of 150,000,000 pounds per hour. When efficiency is not accounted for, our calculated generator productions at this same mass flow rate were 3682 kW and 3334 kW for the gas and coal generators, respectively. These estimates are very close to the actual values, and the reason the coal generator production is lower is because the mass flow rate of coal into the boilers is less than of the gas. However, when efficiency is accounted for, those values drop to a respective 441.7 kW and 463.4 kW per turbine. The loss of energy to the surroundings in the form of heat significantly drops the power generated, which is expected with such a low efficiency.
For electricity and heat generation, the energy utilization factor was 26.2% which was lower than expected. Thus, 26.2% of the input energy is used for power generation during electricity and heat generation. During cogeneration, the efficiency of the plant is increased to 16.7%. The efficiency of the first rankine cycle is 12.0% which means that cogeneration increases the plant efficiency by 4.7% The efficiency of the cogeneration plant is also lower than expected.
Environmental Analysis (CO2 Emissions)
